Too long to read? Watch this short video:
Getting Started
Slow network performance is a direct threat to business operations, impacting everything from employee productivity to customer satisfaction. A sluggish or unreliable network can halt sales, disrupt critical financial transactions, and frustrate hybrid teams trying to collaborate. Identifying the root cause of these issues, whether it’s a saturated link, a misconfigured device, or a failing piece of hardware, is often a complex and time-consuming task without the right visibility. This is the core problem that network performance monitoring tools are designed to solve.
This comprehensive guide moves beyond generic marketing claims to provide a detailed analysis of the leading solutions available today. We will dive deep into twelve prominent tools, from industry staples like SolarWinds NPM and Paessler PRTG to powerful open-source options like Zabbix and Checkmk. Each review focuses on practical application, examining specific use cases for organizations in agriculture, finance, and education, as well as for startups and businesses with strict compliance needs. You will gain a clear understanding of each tool’s real-world strengths, honest limitations, implementation challenges, and pricing structures. Our goal is to equip you with the insights needed to select the right network performance monitoring tool that directly addresses your organization’s unique operational demands and technical capabilities.
1. SolarWinds Network Performance Monitor (NPM)
SolarWinds Network Performance Monitor (NPM) stands as a comprehensive solution for organizations needing deep, real-time visibility into their network’s health. It excels in complex, multi-vendor environments, making it one of the most powerful network performance monitoring tools available. Its core strength lies in its ability to automatically discover and map network devices, providing a dynamic and accurate topology that visualizes dependencies. This feature is invaluable for quickly pinpointing the root cause of an outage, moving beyond simple device-down alerts to understand the full impact on services. For businesses with intricate infrastructures, such as financial firms or educational institutions, this level of detail is critical for maintaining uptime.

Key Features and Use Cases
- Automated Network Discovery: NPM automatically scans your network to identify and add new devices, which is essential for rapidly scaling companies or those managing remote and hybrid work environments.
- Critical Path Visualization (NetPath): This feature traces packet paths hop-by-hop, helping you identify performance bottlenecks not just within your own network but also across the internet to cloud services. This is a crucial tool for businesses reliant on SaaS applications.
- Intelligent Alerting: Configure alerts based on complex nested conditions to reduce alert fatigue. For example, you can set an alert to trigger only if a core switch goes down and CPU load exceeds 90% for more than 10 minutes.
Practical Considerations
The initial setup for NPM can be involved, requiring careful planning to configure discovery, polling settings, and alert thresholds correctly. While its user interface is intuitive, leveraging its full potential demands some expertise. The pricing is subscription-based and scales with the number of monitored elements (interfaces, nodes, volumes), which can be a significant investment for smaller businesses. However, for large enterprises or businesses subject to strict regulatory compliance, the detailed reporting and historical performance analysis justify the cost. For more information on deploying advanced networking solutions, explore these networking and wireless solutions.
Website: solarwinds.com/network-performance-monitor
2. Paessler PRTG Network Monitor
Paessler PRTG Network Monitor is a powerful, all-in-one solution renowned for its sensor-based approach to infrastructure monitoring. It provides a unified view of your entire IT environment, from network devices and servers to applications and cloud services. Unlike tools that specialize in one area, PRTG’s strength is its versatility, making it one of the most flexible network performance monitoring tools for organizations that need comprehensive oversight without juggling multiple platforms. Its ability to monitor everything from bandwidth and traffic to hardware status makes it a favorite among IT generalists in small to mid-sized businesses who wear many hats.

Key Features and Use Cases
- Sensor-Based Monitoring: PRTG uses individual “sensors” to monitor specific metrics on a device (e.g., CPU load, port traffic, disk space). This granular approach allows you to tailor monitoring precisely to your needs, which is ideal for agricultural businesses monitoring environmental sensors alongside network gear.
- Customizable Dashboards and Maps: Create real-time maps that visualize your network topology and device status. This is extremely useful for office managers or operations teams needing a quick, at-a-glance health check of critical systems without diving into technical data.
- Flexible Alerting: Configure alerts through multiple channels, including email, SMS, and push notifications. You can set dependency-based alerts, for instance, preventing a flood of notifications if a downstream switch goes offline due to an upstream router failure.
Practical Considerations
The initial setup for PRTG is remarkably fast, often taking just a few minutes. Its wizard-driven configuration and auto-discovery features make it accessible even for those without deep networking expertise. The primary consideration is its licensing model, which is based on the number of sensors. While the first 100 sensors are free, costs can escalate quickly as you expand monitoring across a larger network. On larger deployments, the monitoring host can become resource-intensive, so careful capacity planning is necessary. Despite this, its user-friendly interface and quick deployment make it a strong contender for businesses needing an effective monitoring solution up and running without a steep learning curve.
Website: www.paessler.com/prtg
3. Nagios XI
Nagios XI is a powerful enterprise-class monitoring solution that builds upon the proven, open-source Nagios Core engine. It provides extensive visibility into network infrastructure, making it a stalwart among network performance monitoring tools for organizations that value customization and control. Its primary strength is its incredible flexibility, derived from a massive ecosystem of community-developed plugins. This allows it to monitor virtually any device, service, or application imaginable. For businesses with unique or legacy systems, such as manufacturing plants or research facilities, this adaptability is a significant advantage, ensuring no critical component is left unmonitored.

Key Features and Use Cases
- Extensive Plugin Ecosystem: With thousands of community-contributed plugins, you can monitor everything from standard network protocols (SNMP, WMI) to specialized industrial equipment and custom applications.
- Advanced Alerting and Escalation: Configure highly granular notification rules to ensure the right person is alerted at the right time. Escalation chains can be built to notify senior staff if an initial alert goes unacknowledged.
- Customizable Dashboards and Views: Users can create personalized dashboards showing only the hosts and services relevant to their role, which is ideal for multi-tenant environments or departmental IT teams.
Practical Considerations
Nagios XI has a steeper learning curve compared to more modern, wizard-driven tools. Its user interface, while functional, can feel dated. Initial setup requires a significant time investment to configure hosts, services, and plugins correctly. The pricing is based on the number of monitored “nodes” (servers, switches, etc.), with a free tier for very small environments. While it offers immense power, its complexity means it’s best suited for organizations with dedicated IT staff who can manage its configuration. Proper deployment is a core part of effective IT infrastructure management.
Website: nagios.com/products/nagios-xi/
4. Zabbix
Zabbix emerges as a powerful, enterprise-grade solution for organizations that prioritize flexibility and cost-effectiveness in their technology stack. As a completely open-source platform, it provides robust capabilities for monitoring everything from network devices and servers to applications and cloud services. Its core appeal lies in its high degree of customization, making it a favorite among IT teams with specific monitoring needs and the technical skills to implement them. For businesses like startups or educational institutions with limited budgets but strong in-house IT talent, Zabbix offers one of the most comprehensive free network performance monitoring tools available.

Key Features and Use Cases
- Multi-Protocol Support: Zabbix natively supports SNMP, IPMI, and JMX monitoring, allowing it to collect performance metrics from a vast range of hardware and applications without requiring external plugins.
- Automated Problem Detection: It can automatically detect problem states based on incoming data, moving beyond simple static thresholds to identify anomalies and predict potential future failures.
- Scalable Distributed Monitoring: The architecture supports a proxy-based model, which is ideal for monitoring remote locations or complex, segmented networks by offloading data collection from the central Zabbix server.
Practical Considerations
The primary trade-off for Zabbix’s power and zero-cost licensing is its complexity. Initial setup, configuration, and ongoing maintenance demand significant technical expertise and time investment. While the community support is very active, there is no official, bundled support unless you purchase a commercial support plan. This makes it a less suitable option for teams without dedicated system administrators. However, for organizations willing to invest the internal resources, Zabbix provides a highly scalable and adaptable monitoring framework that can be tailored to almost any environment, from a small office to a large, distributed enterprise.
Website: www.zabbix.com
5. ManageEngine OpManager
ManageEngine OpManager is a powerful and user-friendly platform that offers comprehensive network infrastructure monitoring. It’s particularly well-suited for small to medium-sized businesses (SMBs) seeking an affordable yet robust solution. The tool provides real-time visibility into the performance of network devices, servers, and virtual machines from a single console. Its strength lies in its ease of use and out-of-the-box support for a wide range of vendors, making it an excellent choice for organizations with mixed hardware environments that need one of the most practical network performance monitoring tools without a steep learning curve. This makes it ideal for educational institutions or agricultural businesses that may not have a large, specialized IT team.
Key Features and Use Cases
- Automated Discovery and Mapping: OpManager can automatically discover up to 15,000 interfaces per minute, creating detailed network maps that help visualize your entire infrastructure. This is crucial for startups experiencing rapid growth.
- Multi-Level Thresholds: Set multiple thresholds for performance metrics (critical, warning, trouble) to receive intelligent alerts. For instance, a financial services firm can get a warning when WAN link latency hits 50ms and a critical alert at 80ms.
- Workflow Automation: Automate first-level troubleshooting tasks, like restarting a service when a server’s CPU usage spikes, which helps reduce mean time to repair (MTTR) and frees up IT staff for more strategic initiatives.
Practical Considerations
While OpManager’s core functionality is strong, some of its most advanced features, like firewall log analysis or application performance monitoring, require separate add-ons or integration with other ManageEngine products. This modular approach keeps the base price low but can increase the total cost of ownership as needs expand. The initial setup is straightforward, but fine-tuning alerting rules and dashboards to your specific environment is key to avoiding noise. Its pricing is transparent and based on the number of devices, making it a budget-friendly option for SMBs that want enterprise-grade monitoring without the enterprise price tag.
Website: manageengine.com/network-monitoring/
6. Datadog
Datadog offers a powerful, cloud-native monitoring and analytics platform that excels in providing unified visibility across complex, hybrid infrastructures. It is particularly well-suited for organizations leveraging cloud services, containers, and microservices architectures. As one of the leading network performance monitoring tools for modern environments, its strength lies in consolidating data from disparate sources, including servers, applications, and network devices, into a single, cohesive view. This is invaluable for DevOps and IT teams in fast-paced tech companies or startups that need to correlate network health with application performance in real-time.
Key Features and Use Cases
- Unified Visibility: Datadog integrates with over 500 third-party tools, allowing teams to monitor cloud-native, on-premises, and hybrid networks from one dashboard. This is essential for businesses migrating to the cloud.
- AI-Driven Anomaly Detection: The platform uses machine learning to automatically identify unusual patterns in network traffic or device performance, enabling proactive issue resolution before users are impacted.
- End-to-End Network Path Analysis: Similar to NetPath, this feature provides hop-by-hop visualization of traffic flows between services, across availability zones, and to external endpoints, helping to pinpoint latency sources.
Practical Considerations
As a SaaS platform, Datadog offers a fast setup with minimal infrastructure overhead. However, its subscription pricing, which is based on hosts, data volume, and features, can become costly for large-scale deployments or companies with high data ingestion rates. While its out-of-the-box dashboards are powerful, deep customization can be more limited compared to self-hosted solutions. For businesses that prefer a hands-off approach to monitoring, leveraging managed IT services can help maximize the value of tools like Datadog without requiring dedicated in-house expertise.
Website: datadoghq.com
7. LogicMonitor
LogicMonitor is a fully automated, cloud-based platform that excels in monitoring complex hybrid and multi-cloud infrastructures. Its agentless architecture and automated discovery capabilities make it a powerful choice for organizations seeking to unify visibility across disparate environments, from on-premises data centers to public cloud services like AWS and Azure. As one of the more modern network performance monitoring tools, it leverages AI to provide predictive analytics and early warnings, helping teams move from reactive troubleshooting to proactive maintenance. This is particularly beneficial for fast-growth companies and businesses with distributed IT assets, where manual configuration is not scalable.
Key Features and Use Cases
- Automated Discovery and Monitoring: LogicMonitor automatically discovers network devices, cloud resources, and applications, applying pre-configured monitoring templates. This drastically reduces setup time for businesses with dynamic or rapidly changing IT environments.
- AI-Driven Predictive Analytics (AIOps): The platform analyzes performance trends to forecast potential issues and identify root causes, enabling teams to prevent outages before they impact users. This is crucial for financial services firms where uptime is paramount.
- Extensive Integrations: It offers thousands of pre-built integrations with ITSM tools like ServiceNow and collaboration platforms like Slack, streamlining workflows and ensuring alerts reach the right teams quickly.
Practical Considerations
As a SaaS solution, LogicMonitor simplifies deployment since there is no on-premises server to maintain; you only need to deploy lightweight collectors within your network. Its subscription pricing is based on the number of devices, which can become costly for larger organizations, but provides predictable operational expenses. While the platform offers extensive out-of-the-box monitoring, some advanced customizations can feel more constrained compared to self-hosted solutions. However, for organizations prioritizing scalability and a unified view of hybrid infrastructure without the overhead of managing the monitoring tool itself, LogicMonitor is a compelling option.
Website: logicmonitor.com
8. Auvik
Auvik is a cloud-based network management solution specifically designed to simplify and automate network monitoring, making it a favorite among Managed Service Providers (MSPs) and internal IT teams. Its primary value proposition is its ease of deployment and its powerful automated discovery, which maps out complex networks in minutes, not hours. This immediate visibility is a game-changer for businesses that lack dedicated network engineers, such as small financial firms or growing agricultural businesses. Auvik provides real-time insights into network performance, helping teams proactively address issues before they impact users.
Key Features and Use Cases
- Automated Discovery and Mapping: Auvik excels at quickly discovering network devices and creating live topology maps. This is ideal for MSPs onboarding new clients or for internal teams managing dynamic remote work environments.
- Real-time Performance Monitoring: It actively monitors device performance, network traffic, and connectivity, sending alerts for anomalies. This allows non-technical managers to quickly understand network health.
- Strong MSP Integrations: It integrates seamlessly with popular PSA and RMM tools, making it one of the most practical network performance monitoring tools for service providers managing multiple client networks.
Practical Considerations
Deployment is straightforward via a lightweight collector, and its cloud-based nature eliminates the need for on-premise server maintenance. The user interface is clean, but some users report that its feature-richness can make navigating specific functions and alerts feel complex initially. Pricing is often bundled in MSP offerings or available directly, typically considered affordable as it avoids complex per-device fees. While powerful for its core purpose, organizations needing extremely deep, granular packet analysis may find its automation-focused approach less intuitive than some more traditional enterprise tools.
Website: https://www.auvik.com
9. Site24x7
Site24x7 offers a powerful, cloud-based platform for all-in-one monitoring, extending beyond just network devices to include servers, applications, and websites. As one of the more versatile network performance monitoring tools, it is particularly well-suited for organizations that need a unified view of their entire IT infrastructure from a single console. Its strength lies in its SNMP-based monitoring and detailed flow analytics, allowing teams to analyze traffic patterns and identify bandwidth hogs with precision. This makes it an excellent choice for startups or financial firms that require end-to-end visibility without investing in multiple separate tools.
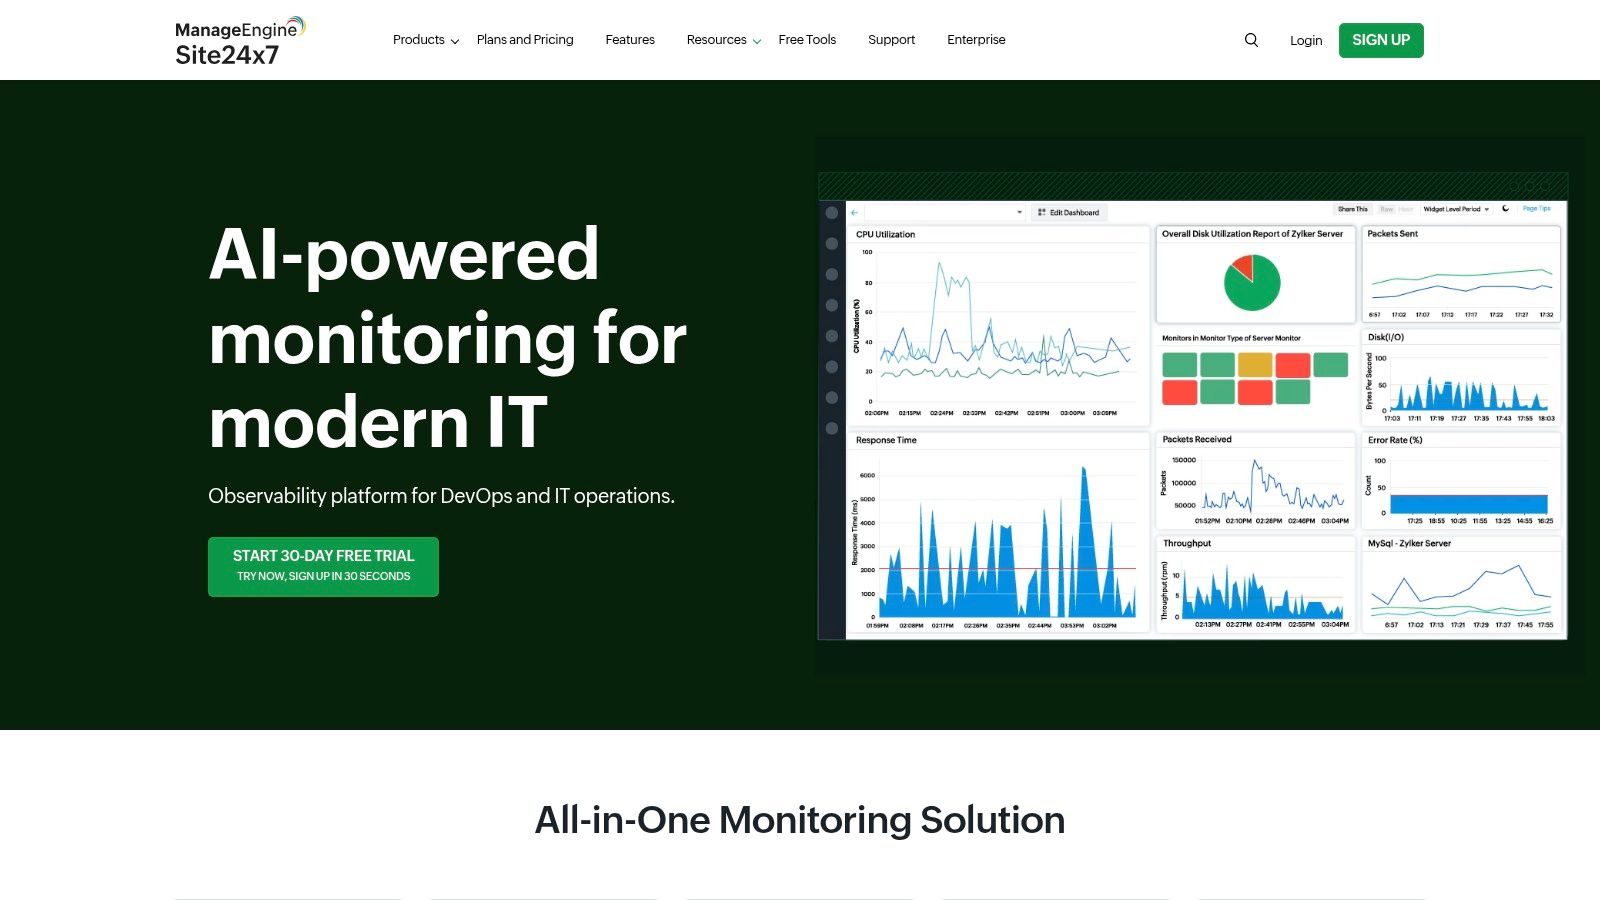
Key Features and Use Cases
- Auto-Discovery and Network Mapping: Site24x7 automatically discovers and maps network devices, providing a visual topology of your infrastructure. This is crucial for businesses with distributed networks to quickly understand device relationships and dependencies.
- Comprehensive Traffic Monitoring: Using protocols like NetFlow, J-Flow, and sFlow, it provides deep insights into network traffic. This helps agricultural or manufacturing businesses monitor bandwidth usage across remote sites and pinpoint performance bottlenecks.
- Customizable Device Templates: While it supports over 11,000 device types from 450+ vendors, you can create custom templates to monitor unique performance metrics, offering flexibility for specialized hardware.
Practical Considerations
The platform’s all-in-one nature can initially seem overwhelming, and some users report that its automation features are less intuitive than those of dedicated network-only tools. While it offers a wide range of monitoring capabilities, its third-party integrations are not as extensive as some competitors. The pricing model is subscription-based and highly scalable, making it accessible for small businesses but potentially complex to calculate for larger, more dynamic environments. However, for organizations seeking a cost-effective, unified monitoring solution that covers network, application, and user experience, Site24x7 provides exceptional value.
Website: www.site24x7.com
10. Checkmk
Checkmk stands out as a highly versatile and powerful monitoring solution that extends beyond typical network devices to cover servers, applications, and cloud services in a single, integrated platform. Its strength lies in a combination of agent-based and agentless monitoring, allowing it to gather incredibly detailed metrics from a vast range of systems. This makes it an excellent choice for organizations with diverse IT environments, such as educational institutions or manufacturing plants, that need unified visibility. As one of the more adaptable network performance monitoring tools, Checkmk excels at providing deep insights without overwhelming users.
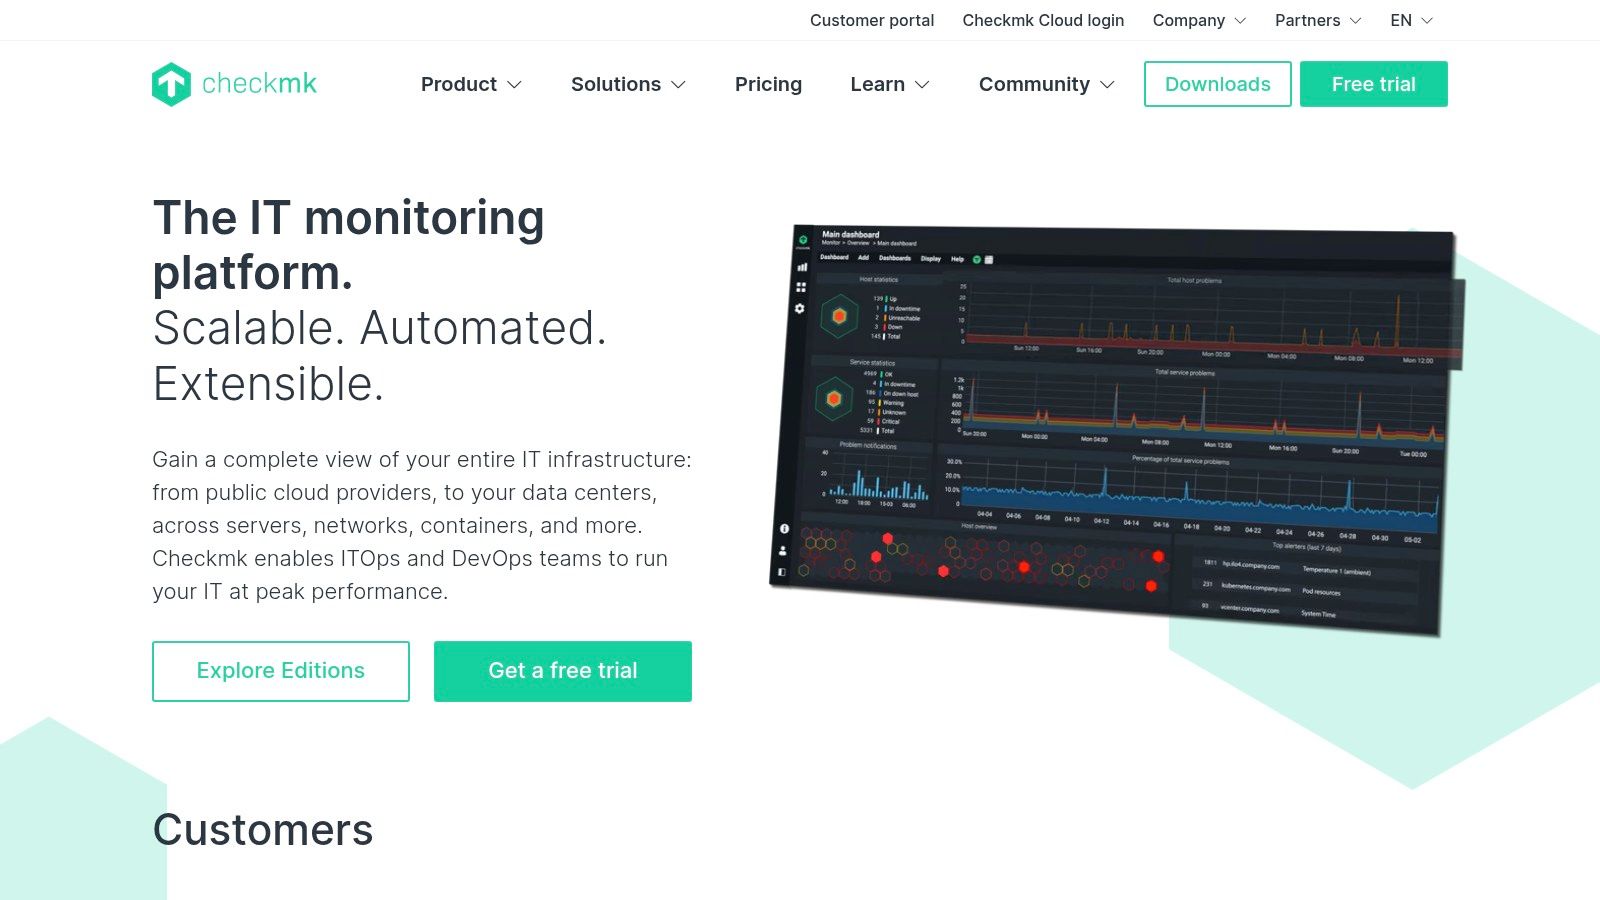
Key Features and Use Cases
- Hybrid Monitoring Approach: Utilizes both agents for deep host-level data and standard protocols like SNMP for network gear, offering the best of both worlds. This is ideal for financial firms needing granular server performance data alongside network switch health.
- Service Discovery Engine: Automatically discovers services running on a host or device and applies pre-configured monitoring templates. This drastically reduces manual setup time, a huge benefit for startups or fast-growing companies with rapidly changing infrastructure.
- Powerful Alerting and Rules Engine: The system’s rule-based configuration allows for highly specific and context-aware alerts, helping to minimize false positives and focus IT teams on genuine issues.
Practical Considerations
While the “Raw Edition” is free and open-source, the Enterprise editions provide more features and professional support. The initial setup requires technical expertise, particularly for customizing checks and integrating with complex systems. The learning curve can be steep for those unfamiliar with its rule-based logic. However, for organizations willing to invest the time, Checkmk offers exceptional scalability and customization, capable of monitoring tens of thousands of services from a single instance, making it a cost-effective solution for large-scale deployments.
Website: checkmk.com
11. Icinga
Icinga is a powerful, open-source monitoring tool that excels in flexibility and extensibility, making it a favorite among DevOps teams and organizations with custom infrastructure. Originally a fork of Nagios, Icinga has evolved into a comprehensive solution for tracking network devices, services, and overall infrastructure health. Its strength lies in its modular architecture, allowing administrators to tailor the system precisely to their needs. This makes it one of the most adaptable network performance monitoring tools for environments where off-the-shelf solutions may not fit, such as in research institutions or tech startups with unique stacks.
Key Features and Use Cases
- Distributed Monitoring: Icinga’s architecture supports distributed and redundant monitoring, which is ideal for geographically dispersed organizations or large-scale data centers needing high availability.
- Extensive Plugin Support: It integrates seamlessly with a vast library of community-developed plugins (including Nagios plugins), enabling monitoring for virtually any device or service imaginable.
- Customizable Dashboards: Users can build role-specific dashboards that provide real-time insights tailored to different stakeholders, from network engineers focusing on latency to executives wanting an overview of service uptime.
Practical Considerations
The primary challenge with Icinga is its steeper learning curve. Initial setup and configuration are text-file-based and require a solid understanding of monitoring concepts and command-line interfaces. While powerful, this can be a significant hurdle for teams without dedicated IT expertise. The user interface, while functional, may feel less modern than some commercial competitors. However, for organizations willing to invest the time, the payoff is a highly customized, scalable, and cost-effective monitoring system with robust community support. Its open-source nature means there are no licensing fees, a major advantage for budget-conscious businesses.
Website: icinga.com
12. ThousandEyes
Acquired by Cisco, ThousandEyes provides a unique, external perspective on network performance by leveraging a global network of monitoring agents. It functions as a SaaS-based Digital Experience Monitoring (DEM) platform, making it one of the most powerful network performance monitoring tools for businesses that rely heavily on cloud services, CDNs, and third-party APIs. Its core value lies in its “outside-in” approach, using synthetic monitoring from strategically placed vantage points to trace network paths and identify performance issues beyond an organization’s firewall. This is indispensable for companies with a distributed user base or those dependent on SaaS platforms like Microsoft 365 or Salesforce, where problems often originate in ISP or cloud provider networks.

Key Features and Use Cases
- End-to-End Path Visualization: ThousandEyes traces network traffic hop-by-hop from its cloud agents to your services, mapping out the entire delivery path and pinpointing sources of latency or packet loss. This helps financial firms, for example, verify low-latency routes to trading platforms.
- BGP Route Monitoring: It actively monitors BGP routes to detect hijacks, leaks, and instability that could disrupt service availability. This is critical for any online business to ensure users can reliably reach their digital properties.
- Synthetic and Real User Monitoring: Combine proactive synthetic tests for baseline performance with real user monitoring (RUM) to understand the actual experience of your end-users across different browsers and geographic locations.
Practical Considerations
As a sophisticated SaaS platform, ThousandEyes’ subscription pricing is usage-based and can become a considerable expense, particularly for extensive monitoring needs. While powerful, the sheer volume of data and the complexity of its visualizations can be overwhelming for teams without dedicated network expertise. The platform’s strength is its external view; it’s not designed to replace traditional on-premise monitoring tools that inspect internal device health. Instead, it complements them by providing visibility into the internet and cloud networks that connect your business to your customers.
Website: www.thousandeyes.com
Network Performance Monitoring Tools Comparison
| Solution | Core Features ✨ | User Experience ★★★★☆ | Value Proposition 💰 | Target Audience 👥 | Unique Selling Points 🏆 |
|---|---|---|---|---|---|
| SolarWinds Network Performance Monitor (NPM) | Automated discovery, real-time monitoring, multi-vendor support | Intuitive UI, scalable | Premium pricing, enterprise-grade | Large enterprises | Comprehensive analytics, SolarWinds integrations |
| Paessler PRTG Network Monitor | Sensor-based customizable monitoring, real-time alerts | User-friendly, quick setup | Flexible licensing, can get costly | SMEs to large networks | Sensor customization, easy to deploy |
| Nagios XI | Advanced alerting, extensible plugins, multi-user access | Customizable, steep learning curve | Open architecture but complex setup | Large networks, technical users | Extensive plugins, strong community support |
| Zabbix | Open-source, real-time monitoring, automated problem detection | Free, scalable | No licensing fees, needs technical skill | Technical users, budget-conscious | Open-source flexibility, active community |
| ManageEngine OpManager | Automated mapping, customizable dashboards, 2000+ device types | User-friendly, affordable | Affordable tiers, limited integrations | SMBs | Device monitoring focus, budget-friendly |
| Datadog | Cloud-native, AI anomaly detection, 500+ integrations | Real-time insights, SaaS limitations | High subscription price | DevOps, hybrid cloud environments | AI-driven analytics, broad integration |
| LogicMonitor | Cloud monitoring, AI predictive analytics, ITSM tools | Real-time alerts, SaaS limitations | High subscription price | Hybrid/multi-cloud enterprises | Automation, scalable, hybrid-cloud focus |
| Auvik | Automated discovery, bandwidth monitoring, PSA/RMM integration | Easy deployment, feature-rich | Affordable, no per-device fees | MSPs and IT teams | MSP focus, simple use |
| Site24x7 | Traffic monitoring, multi-vendor support, customizable templates | Flexible setup, real-time diagnostics | Moderate pricing, fewer integrations | Small to large distributed IT | End-to-end monitoring, flow analytics |
| Checkmk | Agent-based, pre-configured templates, real-time metrics | Scalable, requires technical skill | Open-core model, limited official support | SMEs to enterprises | Deep system monitoring, customizable setup |
| Icinga | Real-time monitoring, customizable dashboards | Flexible but steep learning curve | Open-source with community support | Technical users, enterprises | Distributed monitoring, extensibility |
| ThousandEyes | Synthetic & real user monitoring, route analytics | SaaS model, limited customization | High subscription cost | Enterprises with complex networks | Network tomography, DNS monitoring |
Final Thoughts
Navigating the complex landscape of network performance monitoring tools can feel overwhelming, but making an informed decision is the first step toward achieving a resilient, high-performing, and secure network infrastructure. Throughout this guide, we’ve explored a dozen of the industry’s leading solutions, from comprehensive platforms like SolarWinds NPM and LogicMonitor to powerful open-source alternatives such as Zabbix and Icinga. Each tool presents a unique combination of features, pricing models, and ideal use cases.
The key takeaway is that there is no single “best” tool for every organization. The right choice depends entirely on your specific circumstances, including the size and complexity of your network, your team’s technical expertise, your budget constraints, and your long-term scalability goals. A startup might find the flexibility and low entry cost of Zabbix or Site24x7 appealing, while a larger enterprise with complex compliance needs might gravitate toward the robust, feature-rich environments of SolarWinds or Datadog.
How to Choose the Right Tool for Your Business
To move forward from this guide, your next steps should be strategic and methodical. Begin by assembling your key stakeholders, from IT administrators to non-technical executives, to create a definitive list of your monitoring requirements.
Use this checklist to guide your internal discussion:
- Define Your Core Needs: Are you primarily focused on uptime and availability, or do you need deep packet inspection and application performance correlation? Is cloud and hybrid environment monitoring a priority?
- Assess Your Team’s Skills: Does your team have the expertise to manage and customize an open-source tool like Nagios XI, or would a more user-friendly, out-of-the-box solution like Auvik be a better fit?
- Establish a Realistic Budget: Consider the total cost of ownership. This includes not just licensing fees but also the costs of implementation, training, hardware, and ongoing maintenance.
- Plan for Scalability: Select a tool that can grow with your business. Consider how its pricing and architecture will adapt as your network expands and your monitoring needs become more complex.
- Utilize Free Trials: Almost every commercial vendor on our list offers a free trial or a proof-of-concept. This is your most valuable evaluation tool. Use it to test the software in your own environment, assess its usability, and confirm it can solve your specific pain points.
The Path to Proactive Network Management
Ultimately, implementing the right network performance monitoring tools transforms your IT operations from a reactive, break-fix model to a proactive, strategic one. Instead of waiting for users to report a slow application or a network outage, you will be alerted to performance degradation and potential issues long before they impact productivity. This proactive stance is no longer a luxury; in today’s digital-first world, it is a fundamental requirement for business continuity and competitive advantage. The investment you make today in visibility and control will pay dividends in stability, efficiency, and peace of mind tomorrow.
Choosing, implementing, and managing these powerful systems can be a significant undertaking. If you’re a business in the Monterey Bay Area or beyond looking for expert guidance, Adaptive Information Systems specializes in designing and managing robust IT infrastructures. We can help you select, deploy, and maintain the perfect network monitoring solution to ensure your technology always supports your business goals. Contact Adaptive Information Systems today to learn how we can strengthen your network’s performance and reliability.